

Australia’s rental market in 2026 is being reshaped city by city, and Perth and Brisbane are leading the charge. National rents rose 5.9% annually in the June quarter of 2026 – accelerating from 5.7% the quarter before – bringing the median national dwelling rent to $705 per week, and making rental affordability one of the defining financial challenges facing Australian households right now. For property investors evaluating where to buy or how to position their portfolio, the implications of this data go well beyond the headlines.
Key Takeaways
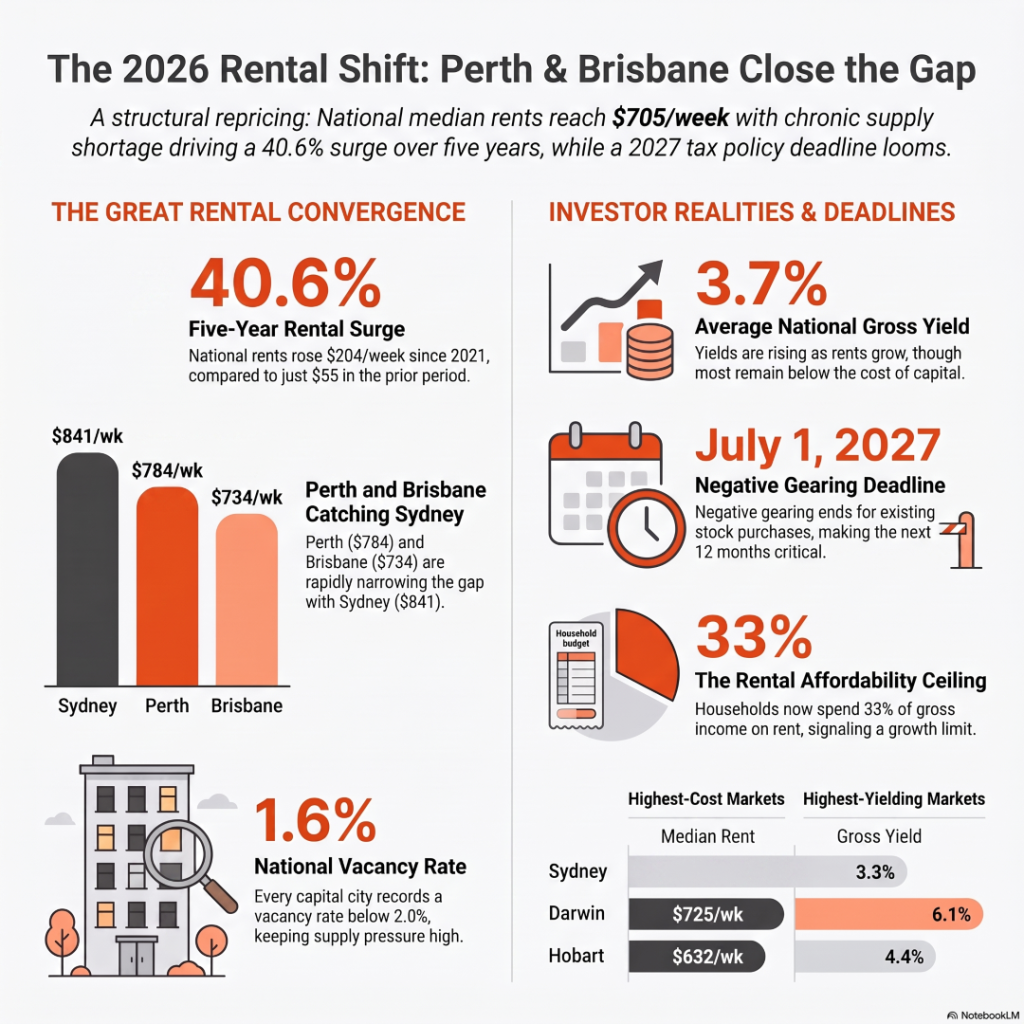
- Australia’s national median rent hit $705 per week in Q2 2026, up 5.9% annually – and Perth ($784/wk) and Brisbane ($734/wk) are rapidly closing the gap on Sydney ($841/wk).
- National rents have surged 40.6% over five years, adding an average of $204 per week to household rental costs – compared to just $55 per week growth in the prior five-year period.
- The national vacancy rate sits at a tight 1.6%, with every capital city recording a vacancy rate below 2.0%, keeping supply pressure firmly in place.
- Gross rental yields have ticked up to 3.7% nationally, driven by sustained rental growth alongside softening home values – but they remain below the cost of capital for most investors.
- The removal of negative gearing for existing housing stock purchases from 1 July 2027 is reshaping the investment case across all capital cities and demands urgent planning now.
What Five Years of Rental Growth Really Costs Australian Households
Imagine you signed a lease in mid-2021. In dollar terms, your weekly rent has likely risen by more than $200 since then. That is not a rounding error – it is an average of $10,400 more per year going out the door.
The data is striking. National rents have jumped 40.6% over five years. In the five-year period before that (2016 to 2021), rents rose just 12.2% – a gain of $55 per week. Rental growth is now running at more than three times that pace, against a backdrop of household incomes that simply have not kept up.
The typical household now allocates roughly one third of gross income to rent, compared to around 27% just five years ago. In regional areas, many households are spending upwards of 35% of gross income on housing – a level economists broadly define as rental stress.
For aspiring investors watching this unfold, the message is clear: the forces driving rental growth are not temporary. They are structural, persistent, and building.
Why Perth and Brisbane Are Closing the Gap on Sydney’s Rental Market
Sydney has long sat at the top of Australia’s rental cost ladder. With a median rent of $841 per week in June 2026, it remains the most expensive capital city in the country. But the gap between Sydney and the next-tier cities is narrowing at a pace most investors did not anticipate.
Perth now sits at $784 per week. Brisbane is at $734 per week. Darwin, despite recording the lowest home values of any mainland capital, commands a median rent of $725 per week – making it the fourth most expensive rental market in the country.
This convergence tells an important story about where rental demand is concentrating. Both investment property markets in Perth and Brisbane have benefited from strong population inflows, constrained new housing supply, and economic conditions that have attracted working-age households seeking more affordable alternatives to Sydney and Melbourne.
Melbourne remains the most affordable mainland capital at $641 per week – a full $200 per week cheaper than Sydney. Hobart records the lowest overall capital city rent at $632 per week.
For investors, the key question is not simply which city has the highest rents. It is which city offers the strongest combination of rental yield, growth trajectory, and supply constraint. On those measures, Perth and Brisbane are compelling.
What Is Driving Australia’s Rental Vacancy Rate to Historic Lows?
Every capital city in Australia currently records a rental vacancy rate below 2.0%. The national figure sits at 1.6% – unchanged from the March quarter and below the five-year average of 1.8%. Total rental listings at the end of June remained 16.7% below their five-year average nationally.
Darwin recorded the tightest listing conditions, with available rentals sitting 26.1% below the long-term average. Sydney followed with listings down 24.1%, and Melbourne recorded a deficit of 18.4%. Adelaide remains the tightest rental market in the country by vacancy rate alone at just 1.0%.
What this means in plain terms: tenants have very little leverage. When a rental comes to market, it is competed for quickly and strongly. Landlords with well-positioned properties are benefiting from conditions that are unlikely to unwind quickly, because supply simply cannot respond fast enough.
I have seen this dynamic play out personally, and it still catches me off guard when I live it rather than just read about it. When a couple of my own investment properties came back to market after vacancies, the rent jumped by 20%. I made a deliberate choice not to pass that full increase onto my existing long-term tenants – that felt wrong to me. But when those properties did roll to new tenancies, what I watched unfold was staggering. We were fielding 20, 30, even 40 applicants for a single property. These were not desperate people with poor rental histories – they were working professionals, families, people doing everything right, competing hard just to secure a roof. That experience changed the way I talk to my mentoring and mortgage clients about the rental market. The data points – vacancy rates, median rents, listing deficits – are important. But nothing makes the structural undersupply story land harder than watching forty people apply for one property. It is not a temporary spike. It is a market telling you something about the gap between where housing supply is and where demand already lives.
Quarterly rental growth has eased slightly – from 2.1% in March to 1.6% in June. Capital cities are growing faster than regional markets this quarter. Why? Regional markets are hitting rental affordability ceilings first, because median incomes outside the capitals are lower and tenants there cannot absorb further increases.
Houses vs Units: Which Property Type Should Investors Be Watching?
After a period of unit outperformance, house rents bounced back in Q2 2026. Median house rents rose 1.7% over the quarter, while unit rents rose just 1.2% – a significant deceleration from units’ 2.5% quarterly rise in March.
Over five years, units have outpaced houses overall – rising 46.3% compared to 38.5% for houses. This post-pandemic catch-up was concentrated in Sydney and Melbourne, where unit demand surged as international students and migrants returned.
In the most recent quarter, Darwin led house rent growth at 4.1%, followed by Hobart at 3.1%. For units, Darwin again led at 2.8%, while Sydney unit growth slowed to just 0.9%.
For investors evaluating property type, this data reinforces the value of understanding local market dynamics rather than relying on national trends alone. The answer to “houses or units?” depends heavily on which city you are investing in and what is driving demand there.
Gross Rental Yields Are Rising – But the Numbers Still Need Stress-Testing
The national gross rental yield moved to 3.7% in June 2026, up from approximately 3.5% at the end of 2025, driven by sustained rental growth and softening home values.
Yields are highest in Darwin at 6.1%, followed by Hobart at 4.4% and the ACT at 4.2%. Sydney and Melbourne, despite high absolute rents, recorded lower yields of 3.3% and 3.9% respectively – a function of the very high asset prices underlying those rental incomes.
Gross yields of 3.7% nationally remain well below the cost of capital for most borrowers. There are relatively few locations across Australia where a typical investor using standard leverage can achieve a positively geared property under current conditions.
That said, rising yields alongside softening values marks a meaningful shift. For investors who can identify well-located assets in markets where yields are improving fastest relative to entry costs, the window for genuinely attractive risk-adjusted returns may be narrowing. Our guide on best property investment strategies during uncertain markets in 2026 walks through how to approach this with discipline.
The Negative Gearing Deadline Every Investor Should Know About
The most significant policy shift affecting property investors right now: the removal of negative gearing for existing housing stock purchases from 1 July 2027, announced in the 2026 Federal Budget.
This change does not affect properties purchased before that date, but it will fundamentally alter the investment case for anyone buying an established home for investment purposes after the deadline. From mid-2027, the ability to offset rental losses against other income disappears for new purchases of existing stock.
For investors currently evaluating the Perth rental market, Brisbane, or any other capital city, this creates a genuine time consideration. Acting before 1 July 2027 preserves access to the existing tax framework. A metropolitan versus regional property strategy needs to be evaluated now with this negative gearing change as a central variable. The next twelve months represent a window that will not reopen.
What the Q2 2026 Rental Data Means for Investors Right Now
The data paints a clear picture for investors who are paying attention:
- Rental demand is durable. Vacancy rates below 2.0% across every capital city confirm structural undersupply is not resolving anytime soon.
- Perth and Brisbane offer improving yield dynamics. As their median rents converge toward Sydney’s, investors who entered these markets earlier are seeing their decisions validated.
- Rental affordability is becoming the ceiling. Future rental growth will increasingly be constrained by what households can realistically afford, not by supply or demand alone.
- The policy clock is ticking. Negative gearing changes on new purchases of existing stock take effect in mid-2027. Investors who act before then preserve an important financial mechanism.
- Yields are improving but require stress-testing. A property viable at current interest rates may not hold up if rates move. Model this carefully before committing.
Conclusion
Australia’s rental market in 2026 is not simply tightening – it is repricing. The 40.6% surge in national rents over five years, the convergence of Perth and Brisbane toward Sydney’s levels, and the persistent supply deficit are not short-term phenomena. They reflect a market where demand is structurally supported and supply cannot restore balance quickly enough.
For investors, this environment presents real opportunity – but also real risk if the numbers are not properly examined. Rising gross rental yields are encouraging, but they remain below the cost of capital. The negative gearing deadline adds urgency. And rental affordability constraints in regional markets are already acting as a ceiling on further growth.
The investors who will benefit most from this cycle are those who understand the data, stress-test their position, and move with confidence and clarity.
That starts with getting the right tools behind you. Head to the Investors Choice Mortgages Hub – your go-to resource for tools like the Mortgage Stress Test, Fix or Float Assessor, and personalised calculators that help you map your next move with confidence. The resources are there to give you a genuine advantage on your property journey. Visit the Hub at app.investorschoice.com.au and start stress-testing your numbers today.
Frequently Asked Questions
Why are Perth and Brisbane rents closing the gap on Sydney in 2026?
Perth ($784/wk) and Brisbane ($734/wk) have experienced rapid rental growth driven by strong population inflows, constrained housing supply, and economic conditions attracting households from southern states. With Sydney at $841/wk, the gap has narrowed substantially as rental demand in these investment property markets has intensified far faster than new housing supply has arrived.
What is the current national rental vacancy rate in Australia?
As of the June quarter 2026, the national dwelling vacancy rate sits at 1.6% – unchanged from the March quarter and below the five-year average of 1.8%. Every Australian capital city currently records a vacancy rate below 2.0%, with Adelaide the tightest at just 1.0%.
What is a good gross rental yield in Australia in 2026?
The national gross rental yield reached 3.7% in June 2026. Darwin leads at 6.1%, followed by Hobart at 4.4% and the ACT at 4.2%. However, most yields remain below the cost of capital for leveraged investors, meaning positive cash flow properties are still relatively rare in the major capitals. Careful location selection and financial modelling are essential before committing to any investment property purchase.
How much have Australian rents risen over the past five years?
National rents have increased 40.6% over the five years to June 2026, adding an average of $204 per week to household rental costs. This compares to growth of just $55 per week (12.2%) in the prior five-year period from 2016 to 2021 – highlighting how dramatically the pace of rental inflation has accelerated. From 1 July 2027, negative gearing will no longer be available for purchases of existing housing stock, meaning investors who buy an established property after that date cannot offset rental losses against their other income. Properties purchased before the deadline retain access to the existing tax treatment. If you are evaluating whether to act now, model your position under both the current and post-deadline frameworks before making a decision.