

Historical Property Prices Australia: What One Number Tells You About 100 Years of Growth
When you look at historical property prices in Australia across a full century, one number rises above all the noise: approximately...
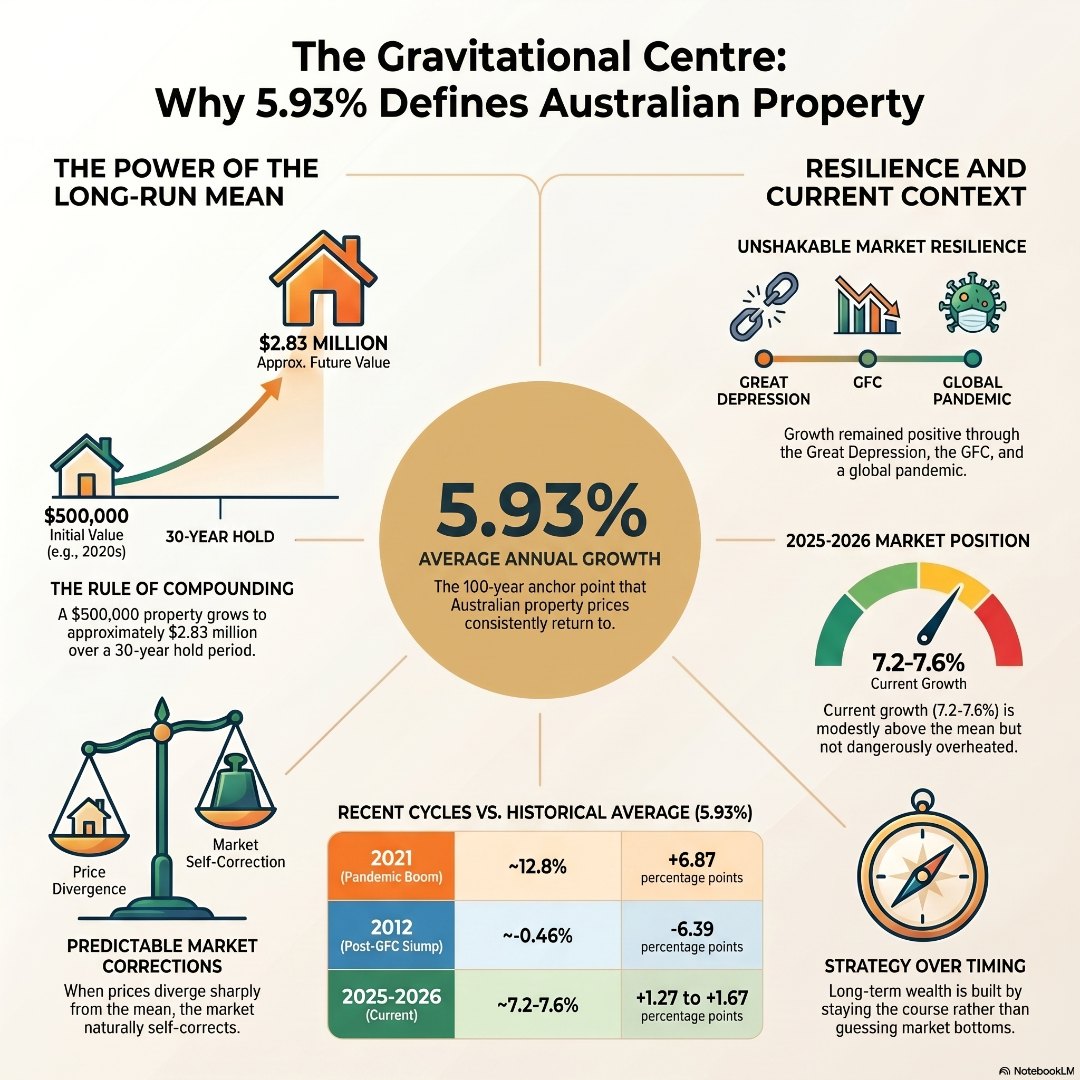
When you look at historical property prices in Australia across a full century, one number rises above all the noise: approximately 5.93% average annual capital growth. That figure, derived from analysis of more than 7,200 suburban markets, acts as the gravitational centre of the Australian property market – the long-run mean that prices always return to, regardless of how far they swing in either direction. Understanding this single metric reframes everything from short-term panic to long-term strategy, and it is the most reassuring number a first home buyer or investor can carry into any market.
Most conversations about the property market are dominated by the short term. Rate decisions. Auction clearance rates. Monthly median price movements. Headlines that oscillate between “market crash” and “property boom” within the space of six months.
The problem with all of this noise is that it tells you almost nothing useful about whether property is a good investment. It only tells you what happened last Saturday.
When you zoom out – really zoom out – and look at Australian house price history across multiple decades, a very different picture emerges. The market, for all its drama, has a centre of gravity. Prices pull away from it during booms and return to it during corrections. That centre sits at roughly 5.93% average annual growth across national residential property markets.
This is not a marketing slogan. It is a data-derived anchor point drawn from the analysis of thousands of suburban markets over a sustained period. And it changes the entire conversation.
Instead of asking “is now a good time to buy?”, the more informed question becomes: “how far is the market sitting above or below its long-run mean right now, and what does history suggest comes next?”
To understand why the long-run average is so powerful, you need to appreciate how dramatically the Australian property market has lurched around it across generations of buyers.
Property cycles in Australia follow a well-worn rhythm of expansion, boom, correction, and stabilisation. The peaks are memorable – the early 1980s surge, the mid-2000s run, the post-GFC recovery, and the extraordinary 2020-2021 pandemic boom that delivered national growth of 12.8% in a single year. The troughs are equally memorable – the early 1990s recession, the GFC-era freeze, and the correction of 2012 when national growth briefly dipped to -0.46%.
What is remarkable is not the drama of those swings. It is the consistency of what comes after each one.
When growth hit 12.8% in 2021 – nearly double the long-run mean – the system corrected. Not because something was fundamentally broken, but because the market was too far above its natural orbit. When growth slumped near zero in 2012, the subsequent recovery was not a surprise to anyone who understood the long-run data. The direction was always predictable. The timing, less so.
This pattern has held across:
The Australian property market absorbed every one of these shocks and returned to its long-run trajectory. That reflects deep structural factors – population growth, land constraints in high-demand areas, a cultural bias toward home ownership, and a financial system that treats residential property as its primary form of collateral. Understanding what drives property prices in Australia at this fundamental level is what separates a confident investor from a nervous one. Read more about those structural forces in our guide on what drives property prices in Australia.
With national growth tracking at approximately 7.2-7.6% heading into 2025-2026, Australian property is currently sitting modestly above its long-run average. That is worth understanding carefully, because “above average” is not the same as “dangerously overheated.”
For comparison, consider the scale of the divergences the market has absorbed before:
| Year / Period | Approx. National Growth | Distance from 5.93% Mean |
| 2021 (pandemic boom) | ~12.8% | +6.87 percentage points above |
| 2012 (post-GFC slump) | ~-0.46% | -6.39 percentage points below |
| 2025-2026 (current) | ~7.2-7.6% | +1.27-1.67 percentage points above |
The current position is elevated, but far from the kind of extreme overshoot that historically precedes sharp corrections. Migration-driven demand and residual credit momentum are supporting prices above the long-run mean, but there is no structural excess comparable to 2021. This context matters enormously when you are trying to decide whether to enter the market now or wait.
A 5.93% annual growth rate may not sound like a headline figure. It is not the kind of number that generates overnight fortune stories. But compounded over a long hold period, it is genuinely transformative.
Consider a property purchased for $500,000. At 5.93% compounding annual growth:
These are nominal figures. They do not adjust for inflation, holding costs, or rental income. But they illustrate why capital growth history in Australia is consistently described as one of the most reliable wealth-building mechanisms available to ordinary Australians – not because it delivers spectacular short-term returns, but because it delivers consistent, compounding ones.
This is particularly important for first home buyers who fear they are entering the market at the “wrong” time. Every generation of Australian buyers has believed they were facing uniquely impossible conditions. Every generation has been wrong in the long run. The buyers who entered in 2012, when sentiment was at its most pessimistic, locked in some of the best value of the decade.
For a deeper look at timing your entry, our guide on timing the property cycle walks through exactly how to align your buying decision with where the market sits – without waiting for a perfect moment that may never arrive.
The historical data gives a clear answer: yes – with an important qualifier. The long-run mean of 5.93% has held across generations, but it is a national average. It smooths out enormous variation between property types, locations, and the quality of suburb selection.
The investors who significantly outperform the mean are those who:
The investors who underperform are those who buy based on media sentiment, follow the herd into overheated markets, or sell during corrections out of panic – crystallising temporary losses into permanent ones.
Predicting capital growth in specific suburbs requires a different toolkit – one that looks at population growth, infrastructure investment, the ripple effect from expensive neighbouring suburbs, and income gentrification. Both lenses matter.
There is a quieter dimension to the 5.93% figure that does not appear in investment calculations. For first home buyers watching prices climb while their deposit savings struggle to keep pace, it is reassuring in a very human sense.
Average property growth in Australia has delivered above-inflation nominal gains through:
I think about a woman I first spoke with back in 2005. She was smart, she had done her research, and she was watching the Sydney market move – week by week, suburb by suburb. Prices felt like they were climbing too fast, and she kept saying she would buy when things settled down. I understood that feeling completely. I had caught myself in the same loop during my own investing journey – those moments where the market noise gets so loud it crowds out everything you actually know to be true. But for her, waiting for it to settle became a habit rather than a strategy. Year after year, the market moved on without her. By the time we spoke again, she had watched two full growth cycles pass. The properties she had been eyeing in 2005 had quietly doubled in value. She had not lost money. She had simply not made any – and that is a cost that never shows up in a spreadsheet.
What history keeps telling us, through recessions and pandemics and rate shocks, is that the market never needed perfect conditions to grow. It needed time. For a buyer who is 30 years old today and anxious about entering the market, the most relevant data point is not what happened last month. It is what happened to people who bought in their early thirties twenty or thirty years ago, and where they stand financially today. The data consistently answers that question the same way.
If you are wondering whether it is too late to start, our guide Is it too late to start property investing? explores this exact question with practical context for buyers at different life stages.
Understanding that historical property prices in Australia average roughly 5.93% annual growth is only the starting point. The more important question is what you do with that knowledge.
The long-run average tells you when the market is cheap relative to history. It tells you when headlines about a “crash” are likely overstated. It tells you why waiting indefinitely for the perfect entry point tends to cost buyers more than it saves them.
But translating that macro insight into a personal property strategy – working out your borrowing capacity, identifying the right location, structuring your finance to withstand rate cycles – requires a different kind of support. That is exactly what the team at Investors Choice Mortgages is here for.
The Investors Choice Mortgages Hub is your starting point. Free tools, expert brokers, and the kind of genuine advice that gives our community an unfair advantage in a market that does not always play fair. Run a Suburb Snapshot, stress-test your mortgage, or ask AI Jane your most pressing property questions – all in one place, built specifically for buyers and investors who want to make decisions backed by data, not headlines.
What is the average annual property growth rate in Australia over the long term?
The long-run average annual growth rate for Australian residential property is approximately 5.93%, derived from analysis of thousands of suburban markets over a sustained period. This figure acts as the market’s gravitational centre – prices overshoot it during booms and return to it after corrections, but decade after decade, the mean holds. It is the single most important number in understanding Australian property market history.
Why did Australian property prices drop in 2022-23 after the 2021 boom?
The 2021 boom saw national growth reach approximately 12.8% – nearly 6.9 percentage points above the long-run average. That kind of divergence is historically unsustainable. When the RBA began its rapid rate-rise cycle in 2022, the market corrected back toward its long-run mean. This is a normal, predictable part of property cycles in Australia, not evidence of structural market failure.
Is Australian property a good investment in 2025-2026?
Current national growth of approximately 7.2-7.6% sits modestly above the long-run average, supported by strong migration demand and ongoing credit momentum. This is elevated but not extreme by historical standards. Long-term property growth in Australia has survived far more severe economic shocks, and buyers who focus on quality suburbs with strong demand drivers are well-positioned for long-run gains.
How long does it take for Australian property to double in value?
Using the Rule of 72, a property growing at the long-run average of 5.93% per year will approximately double in value every 12 years. At the current growth rate of around 7.2-7.6%, that doubling time shortens to roughly 9-10 years. These are nominal figures and do not account for inflation or holding costs, but they illustrate the compounding power of long-term property ownership in Australia.
All market data and research referenced in these articles is sourced from HTAG Analytics’ April 2026 research report: “A Forced Autoregressive Model of Australian Residential Property Price Dynamics: Credit, Migration, Monetary Policy, and Supply Interactions 2003–2026” by Alex Fedoseev and Dr. Matija Djolic, HTAG Analytics.
Investors Choice Mortgages acknowledges HTAG Analytics as an industry-leading source of Australian property market intelligence.
When you look at historical property prices in Australia across a full century, one number rises above all the noise: approximately...

Disclaimer: These are generated via AI – please note that you need to do your own due diligence and read the report yourself to make your own...