

Why National Property Data Fails at the Suburb Level
National property data gives you a number. What it rarely gives you is the truth about a specific suburb. For most Australian investors...
National property data gives you a number. What it rarely gives you is the truth about a specific suburb. For most Australian investors and first-home buyers, relying on national or state-wide figures to make a location decision is one of the most common – and costly – research mistakes made today. The aggregate masks what is actually happening street by street, and by the time the headline number reaches you, the real story has already moved on.
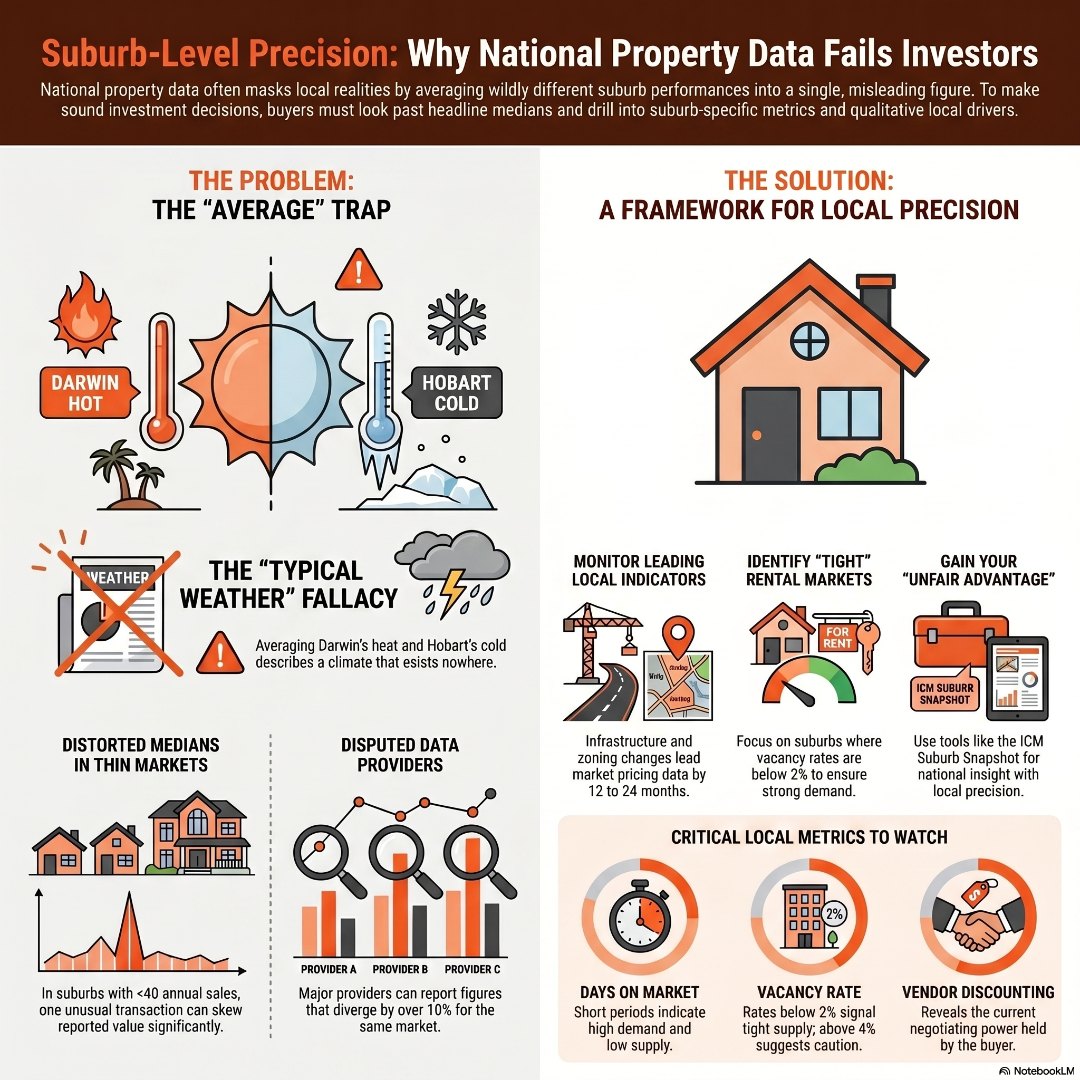
Imagine tipping the results of a warm July day in Darwin and a cold July day in Hobart into the same bucket, averaging them, and calling it “typical Australian winter weather.” That is essentially what happens when property data is reported at a national level.
When you look at Australia-wide or even state-wide property figures, you are averaging together suburbs that are doing completely different things simultaneously. A booming inner-city precinct can pull the headline average up while a struggling outer-ring area pulls it down. The result is a figure that feels authoritative but does not accurately reflect conditions in any individual location.
This is not a minor quirk of statistics. It is a structural problem with how most investors consume property information – and it matters enormously when you are about to commit hundreds of thousands of dollars to one specific address in one specific suburb.
The deeper issue is that suburb-level property performance varies wildly, even within the same city. Two suburbs ten kilometres apart can sit on completely different growth trajectories based on factors that national data simply cannot see: a new train station approved for one but not the other, a school rezoning attracting young families to one side of a council boundary, or a zoning change allowing higher density on one corridor. National data is too high-level to capture any of this granularity.
I learned this firsthand when I first started investing back in 1999 and 2000. The data available at the time only went back ten years – which, for the kind of long-view suburb analysis I wanted to do, simply was not enough. I tracked down John Edwards, the owner and founder of Residex, and convinced him to give me access to twenty years of suburb-level data. That longer view changed everything about how I assessed a location. It is why, for the past two decades, I have encouraged every investor I work with to go back as far as they possibly can when pulling historical data. The more history you can see, the more clearly you understand what actually drives growth in a specific suburb – and what does not. And it reinforced something I have never forgotten: looking at a national figure that says the market grew 5% this year tells you almost nothing useful. That number might be hiding the fact that Perth grew 20% while Hobart fell 10%. You have to get down to the state, the city, and the suburb level before the data starts telling you anything real.
The median price is the most commonly cited property metric in Australia – and arguably the most misused.
In thinly traded suburbs where only 30 or 40 properties change hands in a year, a single unusual sale can shift the reported median by tens of thousands of dollars. A deceased estate selling well below market. A renovated property selling at a premium. A developer clearing stock at a discount. Each of these moves the median, but none of them tells you what a standard property in that suburb is genuinely worth today – or where it is heading tomorrow.
The situation becomes even more complicated when you compare data providers. The ABS, CoreLogic, Domain, and PropTrack each use different methodologies for capturing and calculating property values. In any given year, these providers can report figures that diverge significantly for the same market. A discrepancy of more than ten percentage points between two reputable providers measuring the same capital city in the same twelve-month period is not unheard of. If the headline number itself is disputed between the largest data houses, placing strategic confidence in that number for a specific suburb decision is a risky proposition.
What the median also cannot tell you is the composition of what is selling. If the lower end of a suburb’s market is particularly active in a given quarter – first-home buyers snapping up entry-level stock – the median falls, not because prices are dropping, but because a different segment of the market is moving. None of that nuance survives the journey into a single published figure. And when there are only a handful of sales in a suburb, that data can be distorted so significantly that you are putting hundreds of thousands of dollars at risk – not because you have not done your research, but because you are reading the numbers wrong.
Understanding the biggest mistakes people make when selecting investment properties without proper research often starts precisely here – with investors who trusted a number without understanding what that number was actually measuring.
Getting down to genuine suburb-level analysis requires moving away from headline averages and into the metrics that reflect real market behaviour.
The core data points worth interrogating for any suburb you are seriously considering include:
Tools like RPData, Investar, and SQM Research allow you to drill directly into these suburb-level figures, which is where the real story lives. A suburb can look unremarkable on a state-level heat map and yet be posting tightening vacancy rates, rising rents, and accelerating sales volumes at street level – exactly the conditions that tend to precede price growth.
This is also why predicting capital growth requires you to look at what has historically driven growth in specific suburbs – infrastructure investment, population increases, income changes, and the ripple effect from adjacent, more expensive areas – rather than extrapolating from a national trend line.
Beyond the numbers, there are qualitative local drivers that influence property performance and that no national dataset captures in a timely or granular way.
Infrastructure decisions are among the most powerful. A new train station, a highway upgrade, or a hospital expansion can transform a suburb’s liveability and desirability within a few years of announcement. By the time that transformation shows up in national data, the price lift has often already occurred. Investors who track local council agendas, state government infrastructure budgets, and development applications are working from information that headline market figures lag by twelve to twenty-four months.
Demographic shifts operate in a similar way. When a suburb begins attracting a higher-income cohort – what analysts call gentrification – you see early signals in rising café openings, improving school results, and falling crime statistics well before median prices reflect the change. National data has no mechanism to flag this early. Local intelligence does.
Zoning changes represent another blind spot. A rezoning that allows townhouses where only houses previously stood can change the fundamental supply equation of a suburb overnight. That supply pressure may suppress price growth in the short term even while every national metric is pointing upward for the city. Without suburb-specific zoning awareness, you can be walking into a headwind you never saw coming.
The current limitations of traditional property research are precisely this: traditional data sources are fast at telling you what happened nationally, and slow at helping you understand what is actually happening locally right now.
Rather than relying on any single data provider or headline figure, a disciplined approach to suburb property data analysis looks like this:
The goal is not to achieve certainty – no one can predict property markets with precision. The goal is to replace a single, smoothed national average with a rich, multi-layered understanding of one specific location.
Sound suburb selection for investment properties ultimately comes down to understanding what renters and buyers in that specific area actually want, and what local fundamentals will support ongoing demand – not what the national narrative happens to be saying this month.
Most investors are working from the same publicly available national data and drawing the same broad conclusions. That is precisely why the edge in Australian property investing belongs to those who get underneath the aggregate and into the specifics.
Through the Investors Choice Mortgages Hub that local intelligence is directly accessible to you. The Hub’s Suburb Snapshot tool lets you research suburb trends and market potential quickly. Ask AI Jane delivers instant, research-backed property insights on any location you are evaluating. The Portfolio Profiler helps you understand your investment potential and identify your next best step.
Whether you are an experienced investor comparing growth corridors or a first-home buyer trying to figure out whether that suburb you love is actually a smart move – this is the unfair advantage our community gets: national insight, local precision, and real humans who actually care about your outcome.
Why is national property data unreliable at the suburb level?
National property data aggregates performance across vastly different local markets into a single figure. Suburbs performing strongly and suburbs performing poorly get averaged together, producing a number that may not accurately reflect conditions in any individual location. Local factors like infrastructure investment, demographic shifts, and zoning decisions drive suburb-level outcomes in ways that national data cannot capture.
Why is suburb data less reliable in thinly traded areas?
In suburbs with low annual sales volumes – sometimes fewer than 40 transactions per year – even a handful of unusual sales can significantly distort the reported median price. A single high-end renovation sale or a below-market distressed sale shifts the aggregate figure in ways that do not reflect true market conditions, making thinly traded suburbs particularly difficult to assess from published data alone.
What is the difference between CoreLogic, Domain, and ABS property data?
Each provider uses a different methodology for capturing sales records, calculating medians, and adjusting for timing. This means their figures can diverge materially for the same market in the same period. Neither is necessarily wrong – they are measuring differently. That is precisely why cross-referencing multiple sources and understanding the methodology behind each figure matters when you are making an investment decision based on suburb property data in Australia.
How do I find accurate suburb property data in Australia?
Start with platforms like RPData (CoreLogic), Investar, and SQM Research, which allow you to access suburb-specific sales volumes, vacancy rates, rental yields, and days on market. Cross-reference at least two providers and supplement commercial data with local council development applications and state government infrastructure announcements – these often lead market pricing by twelve to twenty-four months and are the kind of local property market insights that give serious investors a genuine edge.
All market data and research referenced in these articles is sourced from HTAG Analytics’ April 2026 research report: “A Forced Autoregressive Model of Australian Residential Property Price Dynamics: Credit, Migration, Monetary Policy, and Supply Interactions 2003–2026” by Alex Fedoseev and Dr. Matija Djolic, HTAG Analytics.
Investors Choice Mortgages acknowledges HTAG Analytics as an industry-leading source of Australian property market intelligence.
National property data gives you a number. What it rarely gives you is the truth about a specific suburb. For most Australian investors...

When you look at historical property prices in Australia across a full century, one number rises above all the noise: approximately...